
Insulating materials are fundamental to the safe and efficient operation of electrical systems, serving to separate conductive parts from non-conductive ones and prevent unintended current flow. In high-voltage equipment such as motors, generators, transformers, and cables, insulation integrity directly impacts reliability, with studies estimating that up to 98% of electrical failures originate from insulation degradation due to factors like moisture, contamination, thermal stress, or aging.
Regular testing of insulation resistance is therefore critical, and two key diagnostic methods—the Polarization Index (PI) test and the Dielectric Absorption Ratio (DAR) test—offer valuable insights into insulation health. These tests go beyond simple spot measurements by analyzing how resistance changes over time, revealing subtle issues that might otherwise go undetected.
This article provides a comprehensive overview of these tests, drawing from established standards and technical resources. It includes detailed procedures, mathematical formulations, interpretation guidelines, and supporting data to enable practitioners to implement them effectively. While the PI and DAR tests are non-destructive and relatively straightforward, their results must be interpreted in context, considering equipment type, environmental conditions, and historical trends.
Understanding Insulation Resistance
Insulation resistance (IR) quantifies a material’s ability to impede the flow of direct current (DC) under an applied voltage. It is measured using a megohmmeter or insulation tester, which applies a stable DC voltage between the energized conductor and ground (or another reference point) and records the resulting leakage current. The fundamental equation governing IR is derived from Ohm’s Law:
- R = \frac{V}{I}
where:
- R is the insulation resistance (typically in megohms, MΩ, or gigaohms, GΩ),
- V is the applied DC voltage (in volts),
- I is the total leakage current (in amperes, often microamperes, μA).
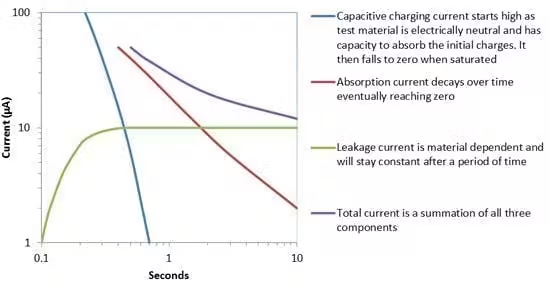
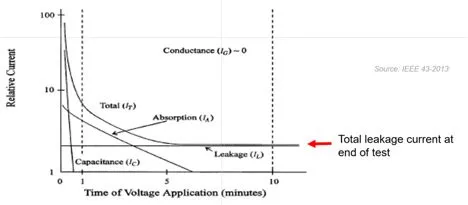
In practice, IR is not a constant value; it evolves over time due to various current components within the insulation system. When voltage is first applied, the total current I_T comprises four primary elements:
- Capacitive Current (I_C): This is the initial charging current that treats the insulation as a capacitor. It surges high at the start but decays exponentially to near zero within seconds (typically 10-60 seconds). Mathematically, it follows I_C = C \frac{dV}{dt}, where C is capacitance and \frac{dV}{dt} is the voltage ramp rate.
- Absorption (Polarization) Current (I_A or I_P): Arising from the polarization of dielectric molecules and electron drift, this current decays more slowly as a power function: I_A = K t^{-n}, where K is a constant depending on the insulation material and voltage, t is time, and n is an exponent (typically 0.8-1.0 for common insulations). It can take up to 10 minutes or more to approach zero in healthy systems, reflecting the energy absorbed to align polar molecules (e.g., due to moisture).
- Conduction (Leakage) Current (I_G or I_R): This is the steady-state current flowing through the bulk insulation material, remaining constant over time. It increases with insulation degradation, such as cracks or voids, and is inversely proportional to resistance.
- Surface Leakage Current (I_L or I_S): Flowing along the insulation surface due to contaminants like dust, oil, or humidity, this current is also constant but highly variable based on environmental conditions.
Thus, the total current is:
- I_T = I_C + I_A + I_G + I_L
Over time, as I_C and I_A diminish, I_T stabilizes to approximately I_G + I_L, providing a baseline for long-term resistance. In contaminated or moist insulation, I_G or I_L dominates early, leading to minimal change in IR over time.
To visualize this, consider the following graph showing the relative contributions of these currents:
IR measurements must account for influencing factors:
- Temperature: IR halves approximately every 10°C increase above a baseline (e.g., 40°C per IEEE Std 43). Correction uses R_C = K_T \cdot R_T, where K_T = 0.5^{(40 - T)/10} and T is the measured temperature in °C.
- Humidity and Contamination: High humidity can reduce IR dramatically; tests should be conducted above the dew point.
- Test Voltage: Selected based on equipment rating (see table below); higher voltages may reveal weaknesses but risk damage if insulation is poor.
Recommended DC Test Voltages (per IEEE Std 43 and similar standards):
| Rated Voltage of Equipment (V) | Recommended DC Test Voltage (V) |
|---|---|
| < 1,000 | 500 |
| 1,000 – 2,500 | 500 – 1,000 |
| 2,501 – 5,000 | 1,000 – 2,500 |
| 5,001 – 12,000 | 2,500 – 5,000 |
| > 12,000 | 5,000 – 10,000 |
Minimum Acceptable IR Values at 40°C (after 1 minute, per IEEE Std 43-2013):
| Insulation Type | Minimum IR (MΩ) |
|---|---|
| Pre-1970 windings, field windings, etc. | Rated kV + 1 |
| Post-1970 AC form-wound coils | 100 |
| Random-wound stators <1 kV, DC armatures | 5 |
The Polarization Index (PI) Test
The PI test evaluates insulation by comparing IR at different times, focusing on the absorption current’s decay to assess dryness and cleanliness. It is particularly effective for form-wound coils in larger machines, where absorption takes longer to stabilize.
Procedure:
- Discharge the insulation fully (ensure no residual voltage >20 V).
- Apply a constant DC voltage (negative polarity preferred to mitigate electroendosmosis effects in wet windings).
- Record IR at 1 minute (IR_{1min}), after capacitive current has decayed—and at 10 minutes (IR_{10min}), after absorption current has mostly subsided.
- Calculate PI as:
- PI = \frac{IR_{10min}}{IR_{1min}} = \frac{V / (I_G + I_L)}{V / (I_G + I_L + I_A)}
In healthy insulation, I_A is significant relative to I_G + I_L, yielding PI > 2. In degraded systems, PI approaches 1.
- Discharge the system post-test (ground for at least 4x test duration).
The test typically takes 10 minutes per phase, but tools like Megger’s PI Predictor can shorten it to 3-7 minutes by predicting the 10-minute value from early data.
Acceptable Values and Interpretation (per IEEE Std 43-2013 and Megger guidelines):
| PI Value | Insulation Condition | Notes |
|---|---|---|
| < 1.0 | Dangerous | Immediate attention needed; high leakage likely due to moisture or damage. |
| 1.0 – 1.5 (Class A), 1.0 – 2.0 (Class B+) | Questionable | Possible contamination; retest after cleaning/drying. |
| 2.0 – 4.0 | Good | Healthy; suitable for service. |
| > 4.0 | Excellent | Very dry and clean; but >8 in older insulations may indicate brittleness. |
For modern insulations with fast-decaying absorption (e.g., epoxy-mica), variants like PI_{5/1} or PI_{1/0.5} may be used. If IR_1 > 5,000 MΩ, PI is unreliable due to low currents. Track trends: A sudden drop signals issues, while a gradual rise might indicate aging.
The Dielectric Absorption Ratio (DAR) Test
The DAR (also called DA or Dielectric Absorption test) is a shorter variant of PI, ideal for random-wound coils or when time is limited. It measures how quickly the capacitive and absorption currents decay, indicating insulation quality.
Procedure:
- Similar to PI: Discharge, apply voltage, record IR at 30 seconds (IR_{30s}) and 60 seconds (IR_{60s}).
- Calculate DAR as:
- DAR = \frac{IR_{60s}}{IR_{30s}}
This captures early absorption decay; in healthy systems, current drops rapidly, yielding DAR > 1.25.
Acceptable Values and Interpretation:
| DAR Value | Insulation Condition | Notes |
|---|---|---|
| < 1.25 | Questionable | Potential moisture or dirt; investigate. |
| 1.25 – 1.6 | Good | Acceptable for most applications. |
| > 1.6 | Excellent | Strong insulation integrity. |
DAR is especially useful for low-voltage motors where PI might yield ratios near 1 due to quick stabilization.
Advantages of PI and DAR Tests
Both tests offer ratio-based metrics independent of temperature, eliminating correction needs for varying conditions—a key benefit since IR alone drops with rising temperature. They detect subtle degradation: Low ratios indicate high leakage from moisture or contaminants, while high ratios confirm effective absorption and low conduction. Unlike spot tests, they provide dynamic insights into insulation behavior, aiding predictive maintenance. For instance, during drying processes, monitoring PI/DAR until >2 signals completion. Limitations include insensitivity to phase-to-phase faults or internal voids; combine with visual inspections or hipot tests for comprehensive assessment.
Conclusion
The PI and DAR tests are indispensable for maintaining electrical system safety and reliability, identifying issues before they escalate into failures. By incorporating them into routine programs—per standards like IEEE Std 43—operators can extend equipment life and minimize risks. Always use calibrated instruments, follow safety protocols (e.g., IEEE Std 510 for high-voltage handling), and trend results over time for optimal decision-making.